Climate Change Overview
Understanding the Big Picture
The Earth’s climate is changing and the global climate is projected to continue to change over this century and beyond. The magnitude of climate change beyond the next few decades will depend primarily on the amount of greenhouse (heat-trapping) gases emitted globally and on the remaining uncertainty in the sensitivity of the Earth’s climate to those emissions. With significant reductions in the emissions of greenhouse gases (GHGs), global annual averaged temperature rise could be limited to 2°C or less. However, without major reductions in these emissions, the increase in annual average global temperatures, relative to preindustrial times, could reach 5°C or more by the end of this century.
The global climate continues to change rapidly compared to the pace of the natural variations in climate that have occurred throughout Earth’s history. Trends in globally averaged temperature, sea level rise, upper-ocean heat content, land-based ice melt, arctic sea ice, depth of seasonal permafrost thaw, and other climate variables provide consistent evidence of a warming planet. These observed trends are robust and confirmed by multiple, independent research groups around the world. Figure 1 shows global average temperature anomalies; since the 1880s global average temperature has warmed approximately 1°C.
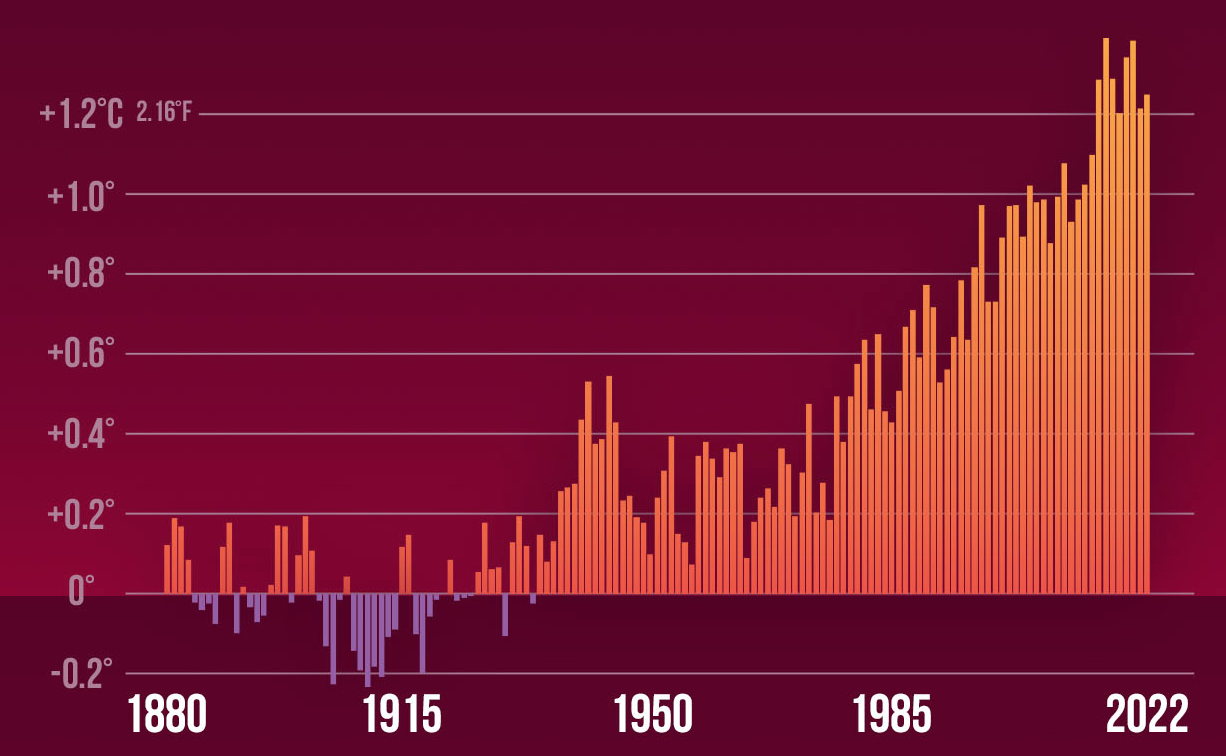
Figure 1. Global Average Temperature Anomalies, departure from 1881-1910.
The plot shows how much global annual average temperatures for the years 1880-2022 have been above or below the 1881-1910 average. Temperatures for years warmer than the early industrial baseline are shown in red; temperatures for years cooler than the baseline are shown in purple. Graphic: Climate Central; Data: NASA GISS and NOAA NCEI. global temperature anomalies averaged and adjusted to early industrial baseline (1881-1910). Data as of 1/12/2023
Observations of the climate system are based on direct physical and biogeochemical measurements, and remote sensing from ground stations and satellites. Information derived from paleoclimate archives provides a long-term context of past climates. Different types of environmental evidence are used to understand what the Earth’s past climate was like and why. Records of historical climate conditions are preserved in tree rings, locked in the skeletons of tropical coral reefs, sealed in glaciers and ice caps, and buried in laminated sediments from lakes and the ocean. Scientists can use those environmental recorders to estimate past conditions, extending our understanding of climate back hundreds to millions of years. Global-scale observations from the instrumental era began in the mid-19th century, and paleoclimate reconstructions extend the record of some quantities back hundreds to millions of years. Together, this provides a comprehensive view of the variability and long-term changes in the atmosphere, the ocean, the cryosphere and at the land surface.
Paleoclimate
Reconstructions from paleoclimate archives allow current changes in atmospheric composition, sea level and climate systems (including extreme events such as droughts and floods), as well as projections of future climates, to be placed in a broader perspective of past climate variability. Past climate information also documents the behavior of slow components of the climate system including the carbon cycle, ice sheets and the deep ocean for which instrumental records are short compared to their characteristic time scales of responses to perturbations, thus informing on mechanisms of abrupt and irreversible changes. Climate records over past centuries and millennia indicate that average temperatures in recent decades over much of the world have been much higher, and have risen faster during this time period, than at any time for which the historical global distribution of surface temperatures can be reconstructed.
Paleoclimate can help us understand climate change on a geological timescale rather than a few human generations. Figure 2 presents paleoclimate reconstruction for the Northern Hemisphere(NH), which reveals average annual temperatures, for the period 1983–2012 was very likely the warmest 30-year period of the last 800 years and likely the warmest 30-year period of the last 1400 years. a) shows the radiative forcing due to volcanic, solar and well-mixed greenhouse gases (WMGHGs). Different colors illustrate the two existing data sets for volcanic forcing and four estimates of solar forcing and the grey line represents WMGHGs for the period 850-2000. b) represents the simulated (red) and reconstructed (shading) Northern Hemisphere temperature anomalies. The thick red line depicts the multi-model mean while the thin red lines show the multi-model 90% range. The overlap of reconstructed temperatures is shown by grey shading.
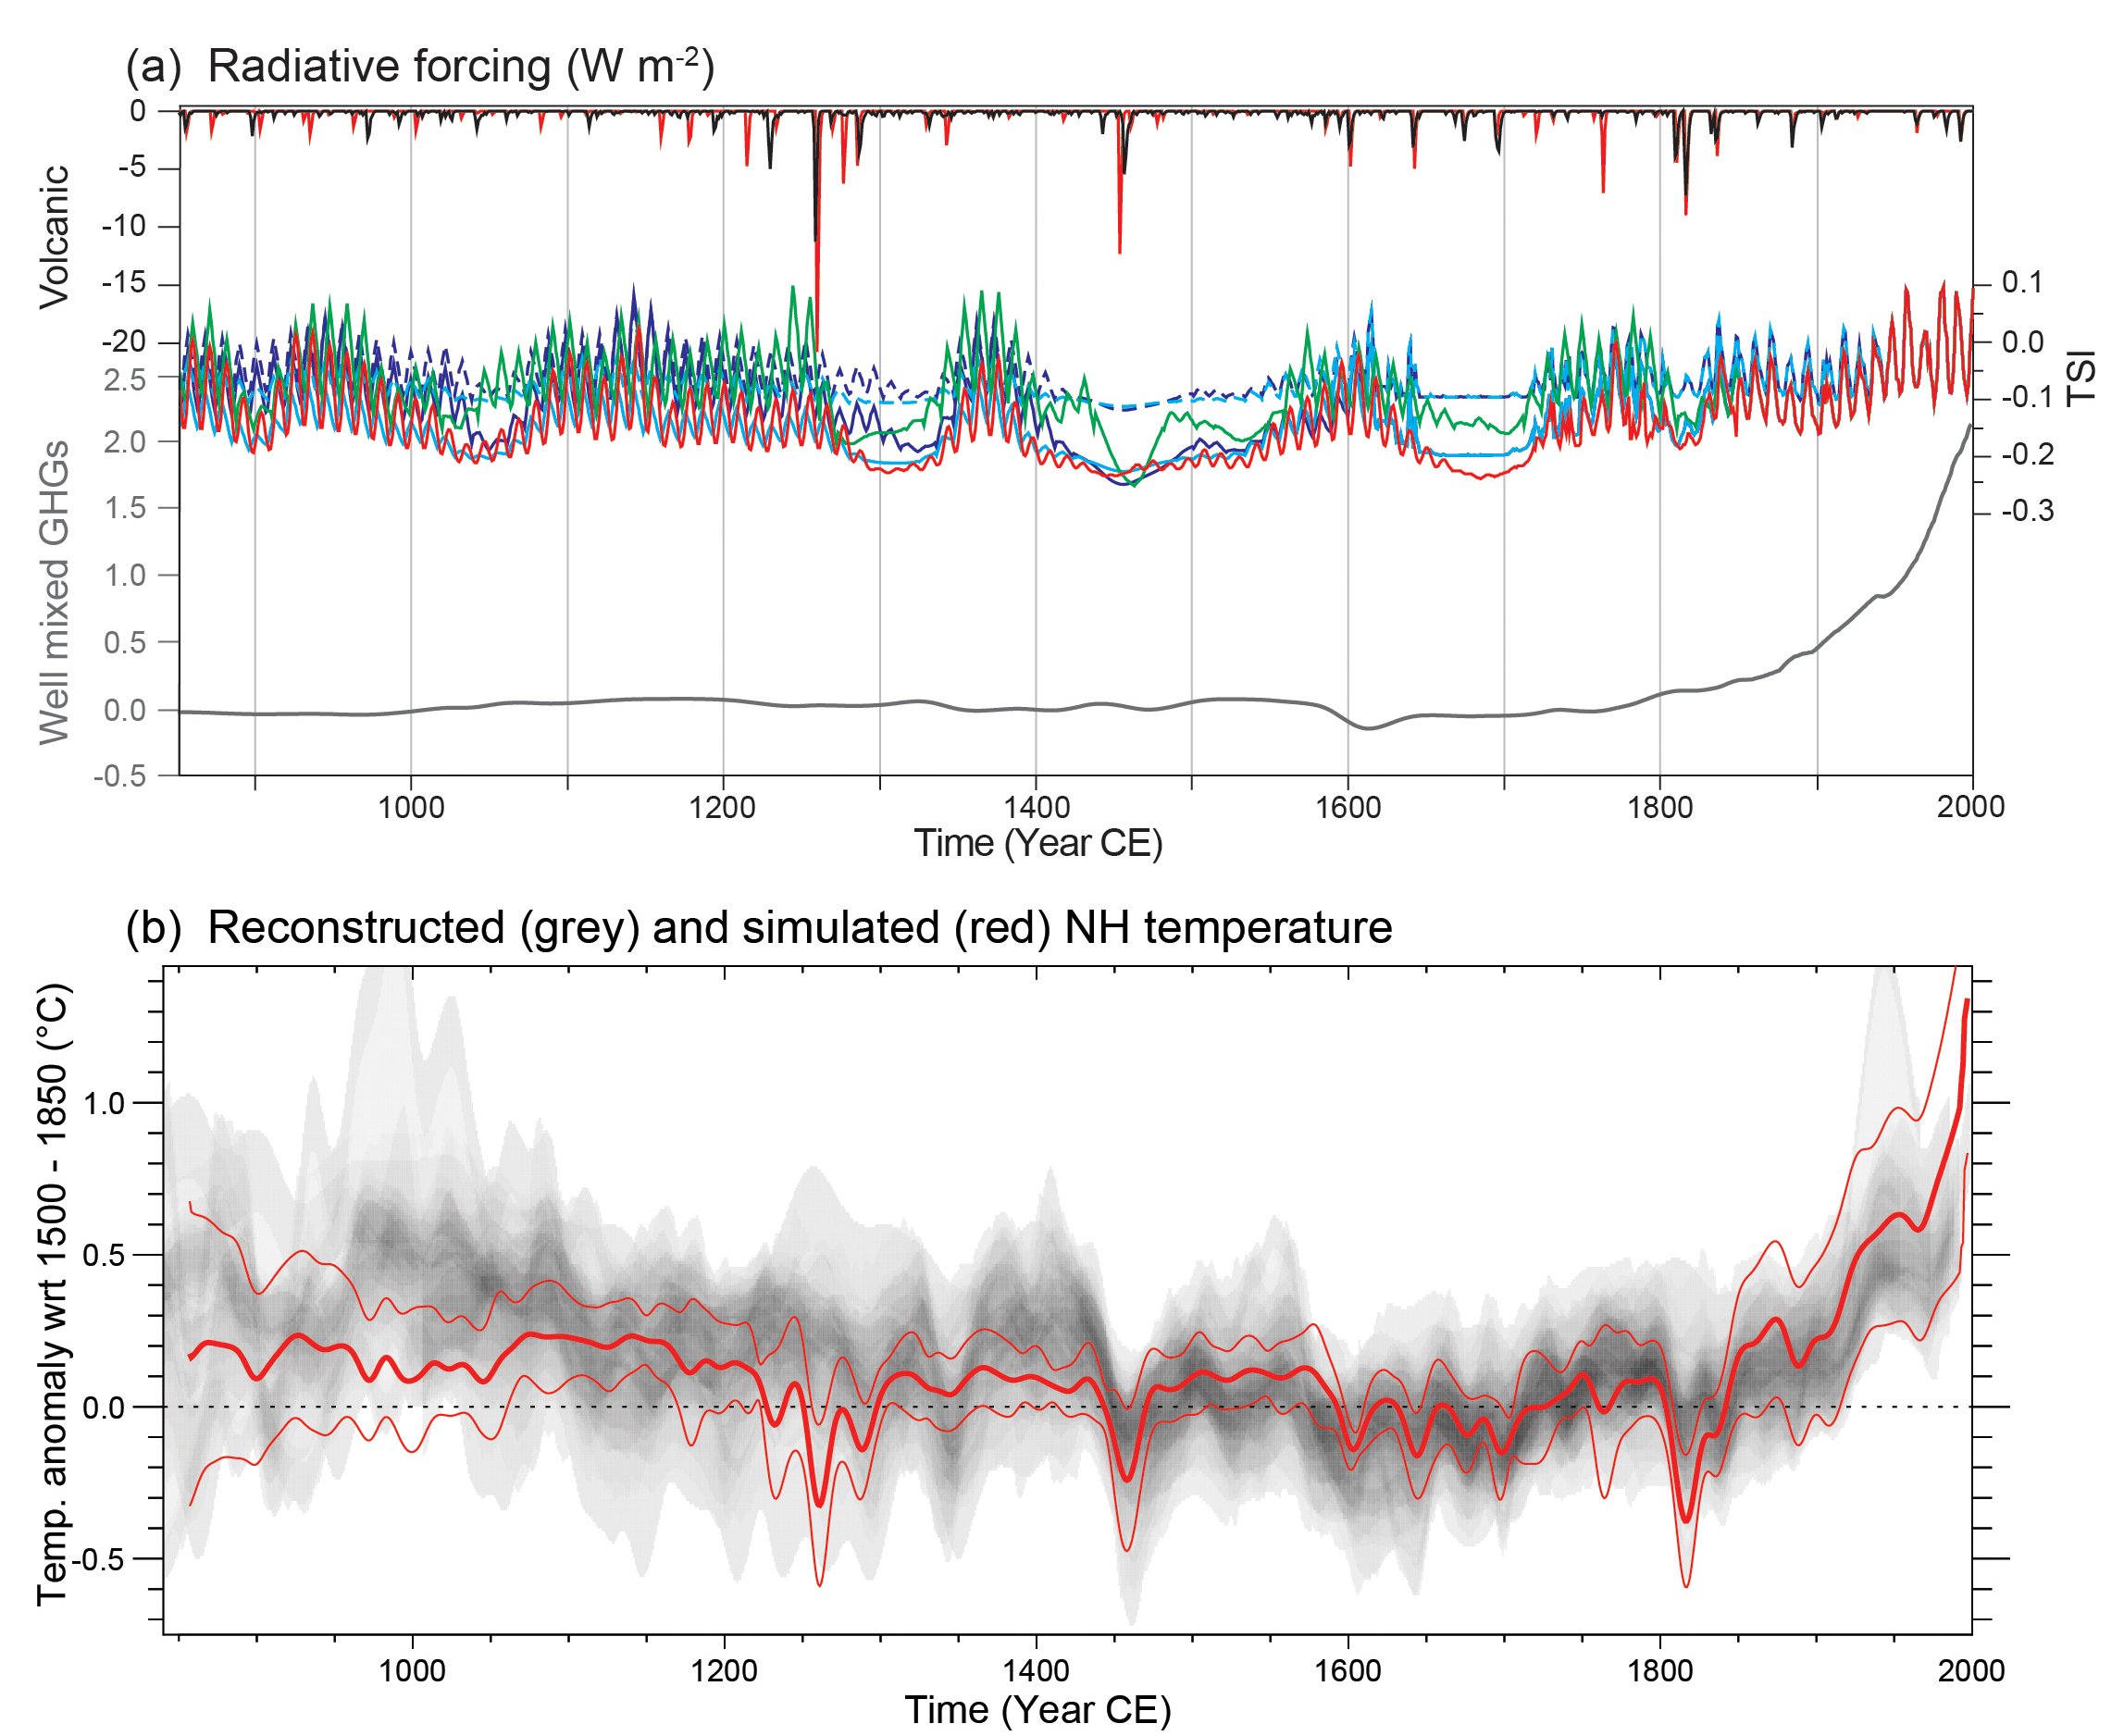
Figure 2. a) Radiative forcing (W/m2) due to volcanic, solar and well-mixed greenhouse gases for the period 850-2000. b) Reconstructed (grey) and simulated (red) Northern Hemisphere Temperature Anomalies for the period 850-2000.
Model projections (Figure 3) indicate that twenty-first century global average warming will substantially exceed the Last Glacial Maximum period and even the warmest Holocene conditions; producing a climate state not previously experienced.
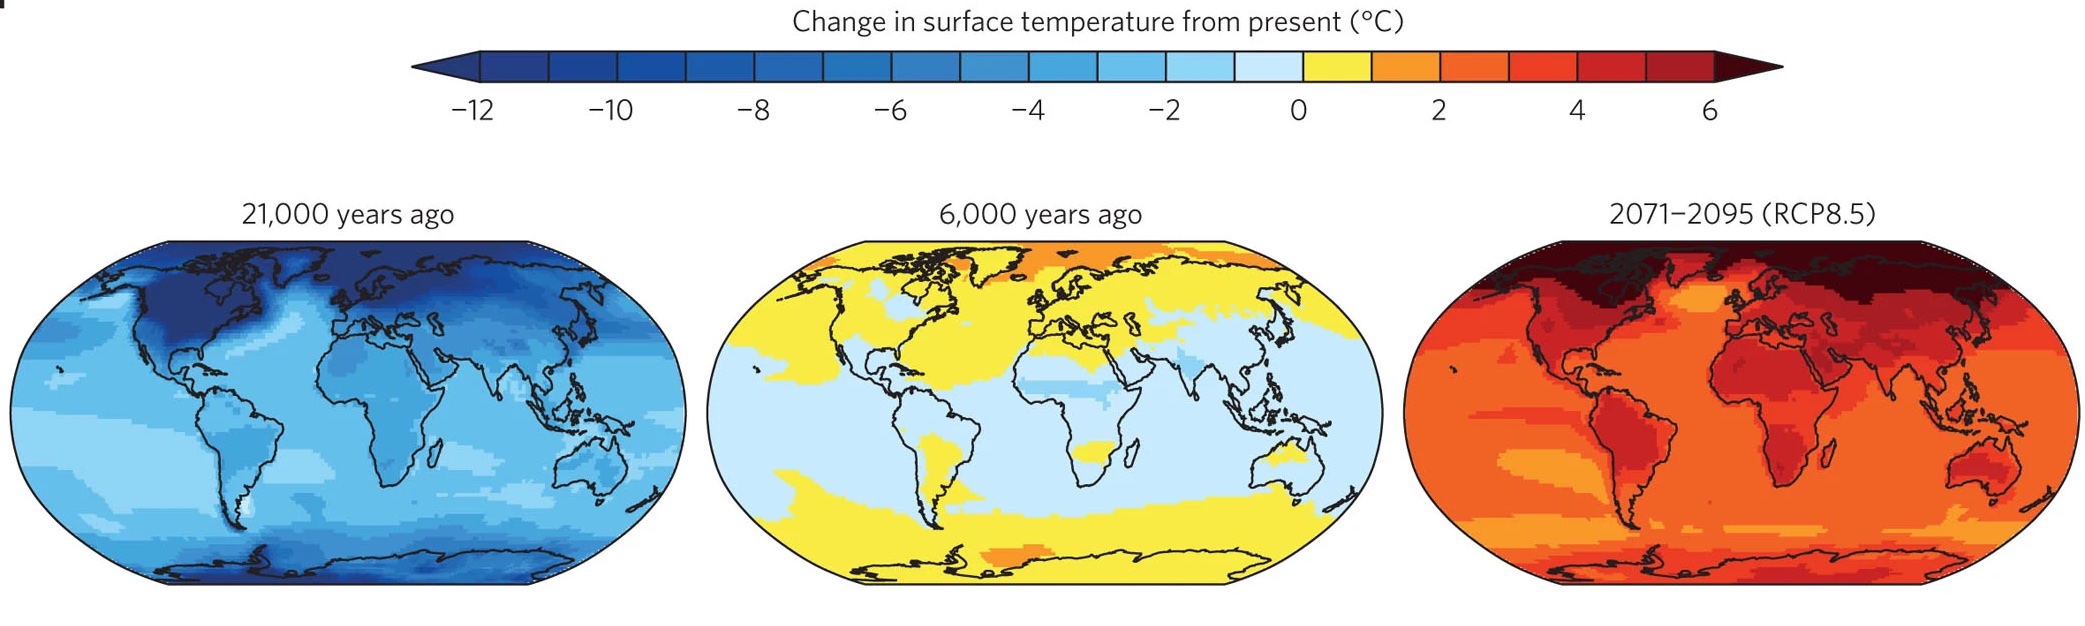
Figure 3. Model-simulated global temperature anomalies for the Last Glacial Maximum (21,000 years ago), the mid-Holocene (6,000 years ago), and projection for 2071–2095, under RCP8.5
What this means
Earth’s climate is now changing faster than at any point in the known history of the climate, primarily as a result of human activities. There is scientific consensus that unmitigated carbon emissions will lead to global warming of at least several degrees Celsius by 2100, resulting in high-impacts of local, regional and global risks to human society and natural ecosystems. Global climate change has already resulted in a wide range of impacts across every region of the earth as well as many economic sectors.
Impacts related to climate change are evident across regions and in many sectors important to society, such as human health, agriculture and food security, water supply, transportation, energy, and biodiversity and ecosystems; impacts are expected to become increasingly disruptive in the coming decades. There is very high confidence that the frequency and intensity of extreme heat and heavy precipitation events are increasing in most continental regions of the world. These trends are consistent with expected physical responses to a warming climate. The frequency and intensity of extreme high temperature events are virtually certain to increase in the future as global temperature increases. There is high confidence that extreme precipitation events will very likely continue to increase in frequency and intensity throughout most of the world. Observed and projected trends for other types of extreme events, such as floods, droughts, and severe storms, have more variable regional characteristics.
Observed changes over the 20th century include increases in global air and ocean temperature, rising global sea levels, long-term sustained widespread reduction of snow and ice cover, and changes in atmospheric and ocean circulation as well as regional weather patterns, which influence seasonal rainfall conditions. These changes are caused by extra heat in the climate system due to the addition of greenhouse gases to the atmosphere. These additional greenhouse gases are primarily input by human activities such as the burning of fossil fuels (coal, oil, and natural gas), deforestation, agriculture, and land-use changes. These activities increase the amount of ‘heat-trapping’ greenhouse gases in the atmosphere. The pattern of observed changes in the climate system is consistent with an increased greenhouse effect. Other climatic influences such as volcanoes, the sun and natural variability cannot alone explain the timing and extent of the observed changes.
Climate, refers to the long-term regional or global average of temperature, humidity and rainfall patterns over seasons, years or decades.
While the weather can change in just a few hours, climate changes over longer timeframes. Climate change is the significant variation of average weather conditions becoming, for example, warmer, wetter, or drier—over several decades or longer. It is the longer-term trend that differentiates climate change from natural weather variability.
Human activity leads to change in the atmospheric composition either directly (via emissions of gases or particles) or indirectly (via atmospheric chemistry). Anthropogenic emissions have driven the changes in WMGHG concentrations during the Industrial Era. Radiative forcing (RF) is a measure of the net change in the energy balance of the Earth system in response to some external perturbation; positive RF leads to a warming and negative RF to a cooling. The RF concept is valuable for comparing the influence on global mean surface temperature of most individual agents affecting the Earth’s radiation balance. Figure 4 shows the Radiative Forcing and Effective Radiative Forcing (ERF), by concentration change, between 1750 and 2011, with associated uncertainty range.
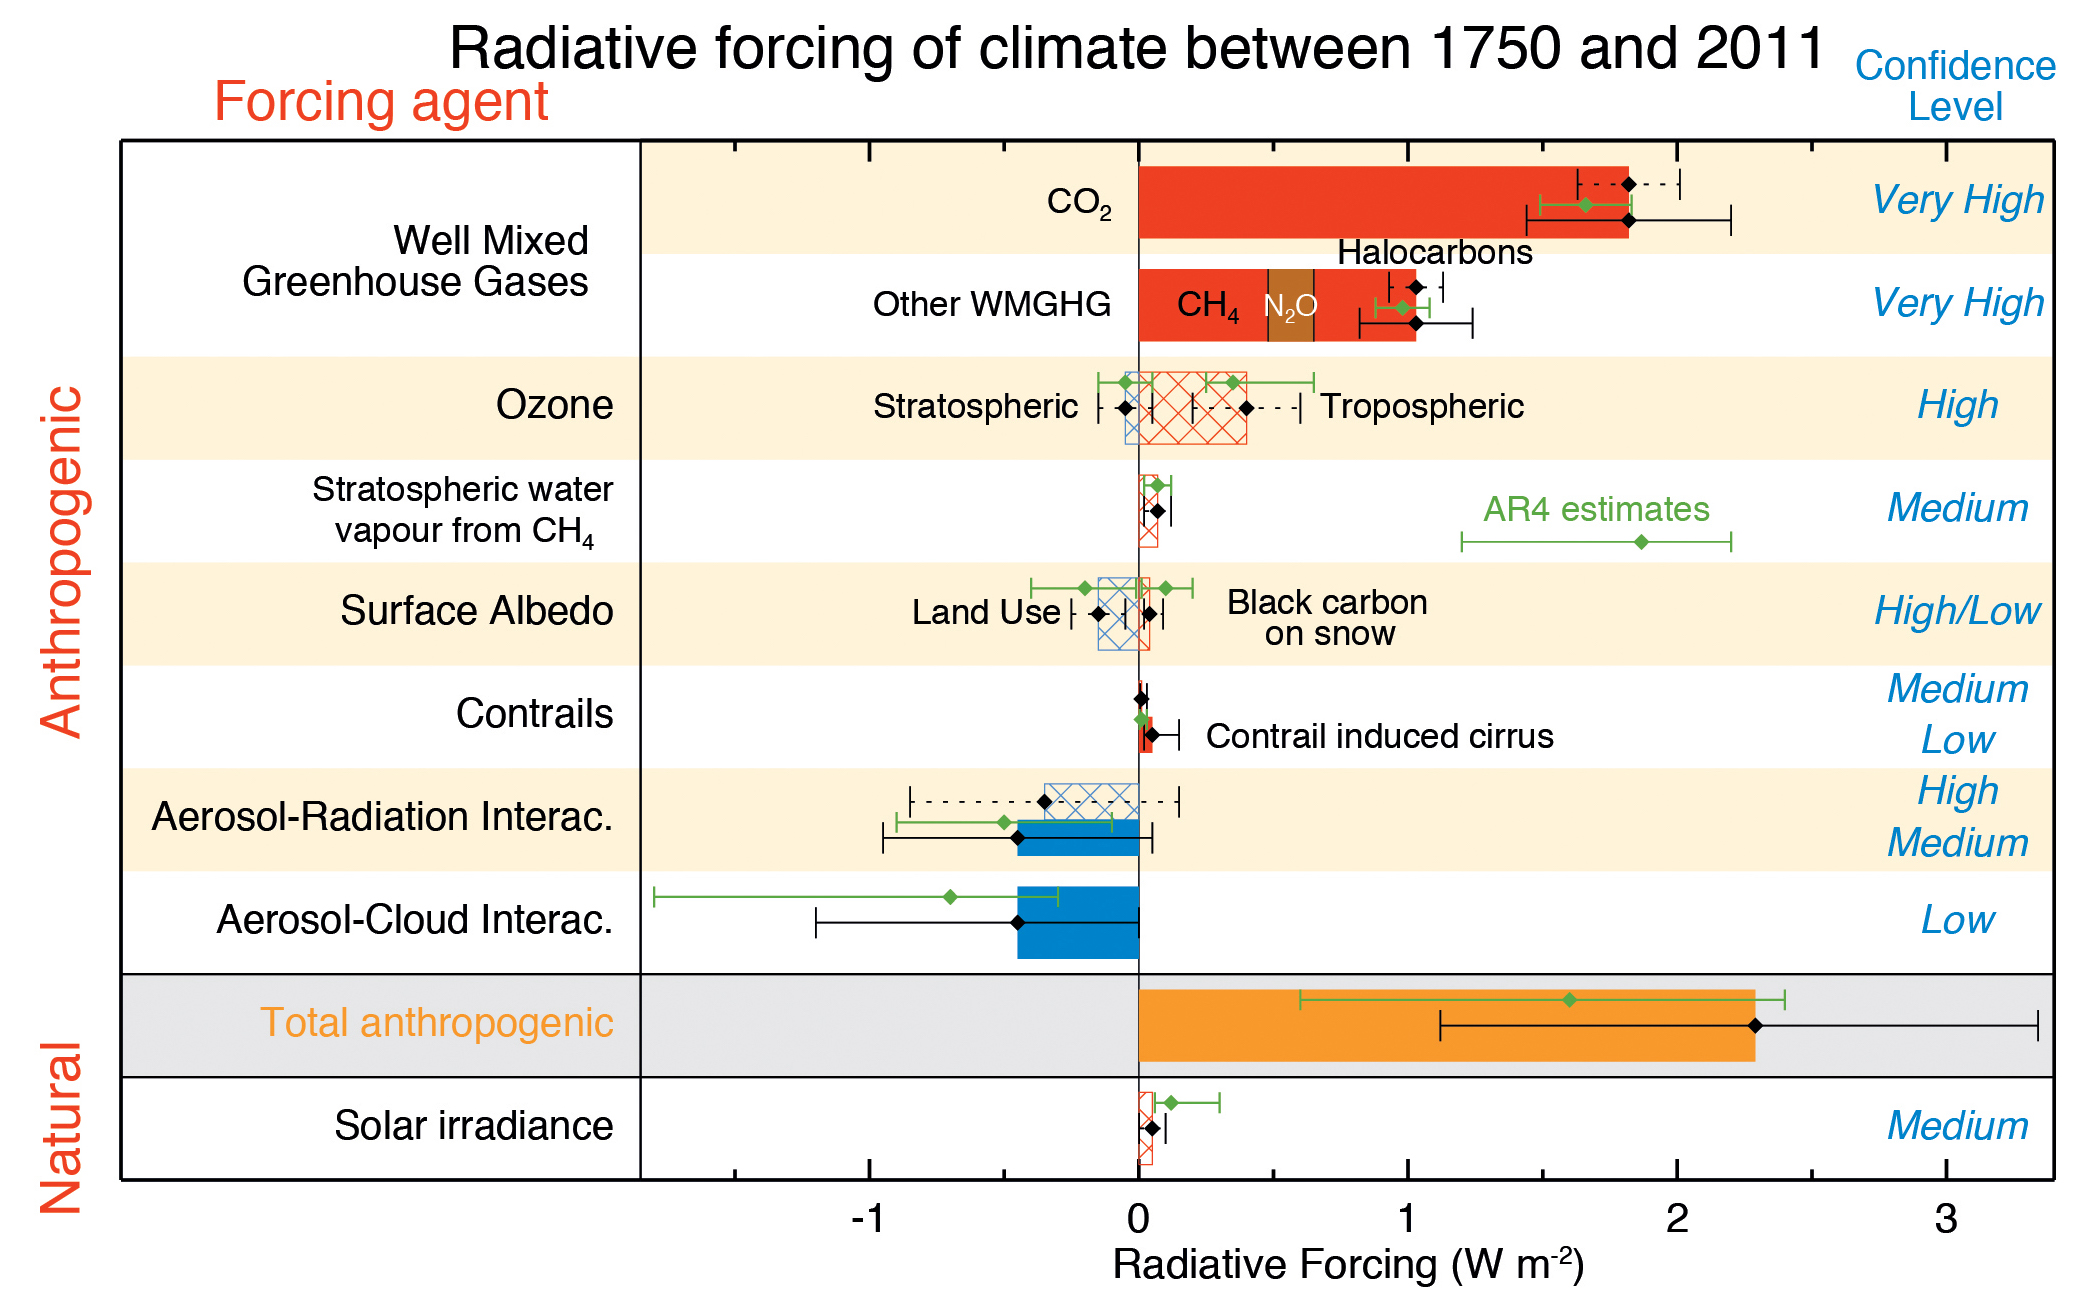
Figure 4. Radiative Forcing (RF) and Effective Radiative Forcing (ERF) of climate change during the Industrial Era, 1750-2011. Solid bars are ERF, hatched bars are RF, green diamonds and associated uncertainties are for RF.
Figure 5. Total annual anthropogenic greenhouse gas (GHG) emissions (gigatonne of CO2-equivalent per year, GtCO2-eq/yr) for the period 1970 to 2010, by gases.
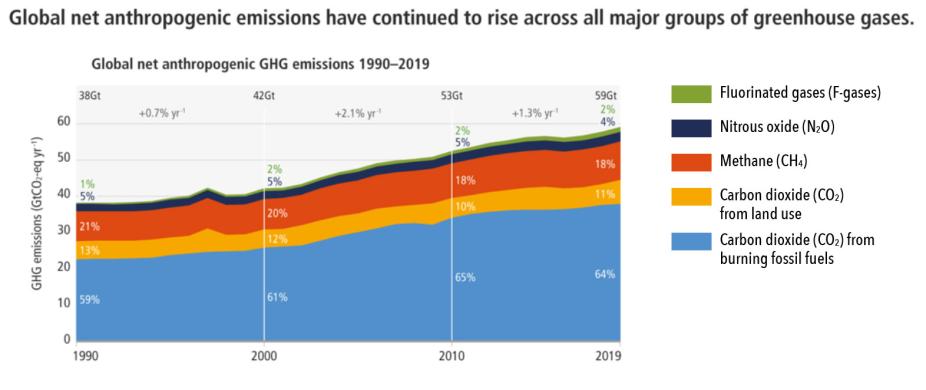
Figure 5. The graph shows human-caused emissions over time for individual greenhouse gases. Carbon dioxide (CO2) from fossil fuel use and industry is the single largest contributor to total emissions at 64%, while CO2 from land use change and forestry accounts for 11% and methane (CH4) contributes 18%. Source, IPCC Working Group III, 2022.
The Coupled Model Intercomparison Projects (CMIPs)
Understanding our current and future climate are questions that are too large and too complex to be tackled by a single country, agency or scientific discipline. Through international scientific cooperation and partnerships, the World Climate Research Program (WCRP) supports the coordination of partners and modeling groups participating in the Coupled Model Inter-comparison Projects, or CMIPs. the CMIPs advance our understanding of the multi-scale dynamic interactions between natural and social systems that affect climate. Over time, as participation in CMIP increased and the number and complexity of climate models expanded, the need for increasingly detailed and organized experiments led to CMIP becoming an integrated framework within which a number of individual Model Intercomparison Projects (MIPs) are organized. MIPs are sets of experiments and simulations designed to test and compare specific aspects of climate models. Each individual MIP lays out an experimental design aimed at improving understanding of:
- important physical processes in the climate system; or
- the response of the climate system to external drivers (such as increasing greenhouse gases).
The climate science community relies on models to understand the Earth’s carbon cycle feedbacks in response to anthropogenic emissions, which lead to changes in atmospheric concentrations of greenhouse gases and aerosol, and thus ultimately result in radiative forcings that drive the climate system changes. The CMIPs provide a coordinating framework for these studies by defining a suite of model experiments for coupled atmosphere-ocean general circulation and Earth system models. Next to more process-oriented studies, one suite of experiments under CMIP is always focused on the climate response to different plausible future societal development storylines and associated contrasting emission pathways (scenarios). The goal of these ‘scenarios’ is to outline how future emissions and land use changes could translate into responses in the climate system. While independent of the regularly produced IPCC-UNFCCC Assessment Reports, CMIP results nevertheless are coordinated and directly inform the Assessments. CMIP phase 5 (CMIP5) provided the foundation for the 5th Assessment Report released in 2013 and 2014, and the 6th Assessment Report released in 2021 and 2022, is drawing from CMIP6, the latest collection of simulations done by the climate science community around the world.
Coupled Model Intercomparison Project Phase 6 (CMIP6)
The Sixth Phase of the Coupled Model Intercomparison Project (CMIP6) comprises 23 individual MIPs. Future climate change simulations are coordinated within ‘ScenarioMIP’ for which approximately 30 climate models contributed results. Additionally, the Diagnostic, Evaluation and Characterization of Klima (DECK) experiments are central to CMIP6 as they involve the historical simulations (1850–near present) that allow evaluation of the model’s simulation of past climate. While MIPs are given priority by CMIP, and organizations can participate in as many or few as they are able, the DECK experiments are mandatory for any model to enter into the CMIP. Figure 6 illustrates the complex and interconnected nature of CMIP6.
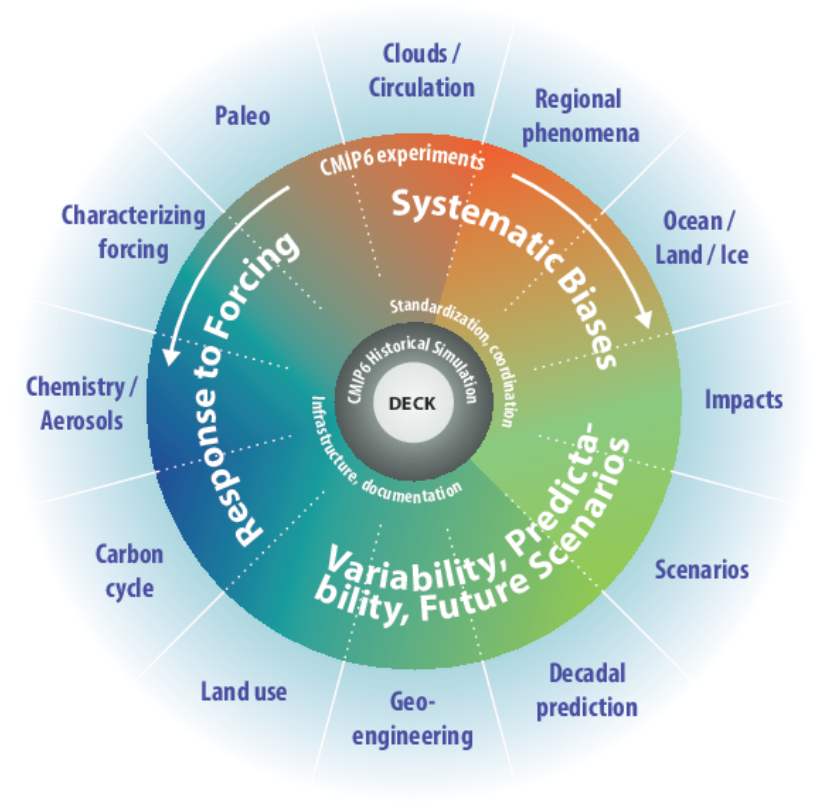
Figure 6. CMIP6 experimental organization. The DECK experiments and surrounding inner ring demonstrate the foundational nature of the historical simulations within the CMIP6 framework. Shown in the outer ring are some of the CMIP6 MIPs which attempt to address the topics displayed in the middle ring.
Understanding Future Climate Scenarios
The scenario approach is used to characterize the range of plausible climate futures and to illustrate the consequences of different pathways (policy choices, technological changes, etc). They are chosen to span a wide range without any tie to likelihood; the scenarios serve as ‘what if’ cases. Over the past three decades, the approach to formulating the different ‘scenarios’ has evolved from a climate-centric to an increasingly societal development-centric concept, albeit with the same underlying goal of providing insight into a range of plausible climate outcomes. CMIP5 used Representative Concentration Pathways(RCPs) and CMIP6 introduces the Shared Socio-economic Pathways (SSPs). To distinguish the magnitude of climate forcing, the numbering reflects a designated amount of radiative forcing (a measure of the extent to which GHGs in the atmosphere warm or cool the climate) measured in watts per square meter (W/m2) reached by 2100 (i.e., 2.6, 4.5, 6.0 and 8.5 W/m2 of change over pre-industrial, respectively). CMIP6 introduced forcing of 1.9 W/m2 to offer insight into the climate response that might be reflective of the Paris-Accord target.
For CMIP6, each SSP drives a corresponding future projection of greenhouse gas emissions and land-use change under the baseline SSP storyline. The SSPs were designed to function in combination with a new and improved version of RCPs. As such, different climate policy futures can be superimposed on SSPs to represent the influence of different climate policy choices (i.e. switching to renewable energy from fossil fuels) and the ease or difficulty in reaching the end-of-century radiative forcing goal specified by an RCP. The different policy scenarios lead to different levels of radiative forcing, with higher values representing stronger climate warming effects. The particular forcing values were chosen to allow easy comparison of the new scenarios to the RCPs used in the CMIP5 and IPCC AR5. Not all possible combinations of SSPs and forcing scenarios are viable and therefore, some do not have simulations. For example, SSP5 which prioritizes fossil-fuel development, thereby establishing a world with high emissions, is incompatible with a low forcing scenario (i.e. 1.9 W/m2), which would require stricter climate policy and strong mitigation, and therefore low greenhouse gas emissions.
The CMIP model results, as driven by scenarios, have become standard reference inputs for work concerning climate change science, impacts, vulnerability, adaptation, and mitigation. Scenarios should be used as tools to help understand the characteristics and magnitude of emerging climate signals to inform decisions. Focusing solely on end-of-century outcomes is an inadequate way to evaluate the usefulness of a given scenario. For purposes of informing societal decisions, shorter time horizons are highly relevant.
CMIP6
The SSPs represent possible societal development and policy paths for meeting designated radiative forcing by the end of the century. CMIP6 includes scenarios with high and very high GHG emissions (SSP3-7.0 and SSP5-8.5) and CO2 emissions that roughly double from current levels by 2100 and 2050, respectively, scenarios with intermediate GHG emissions (SSP2-4.5) and CO2 emissions remaining around current levels until the middle of the century, and scenarios with very low and low GHG emissions and CO2 emissions declining to net zero around or after 2050, followed by varying levels of net negative CO2 emissions (SSP1-1.9 and SSP1-2.6). Emissions vary between scenarios depending on socio-economic assumptions, levels of climate change mitigation and, for aerosols and non-methane ozone precursors, air pollution controls. Alternative assumptions may result in similar emissions and climate responses, but the socio-economic assumptions and the feasibility or likelihood of individual scenarios are not part of the assessment. Figure 7 presents projected emissions and additional warming causes for each of the SSPs. Figure 8 shows global average temperature rise for the primary Scenarios presented in IPCC AR6.
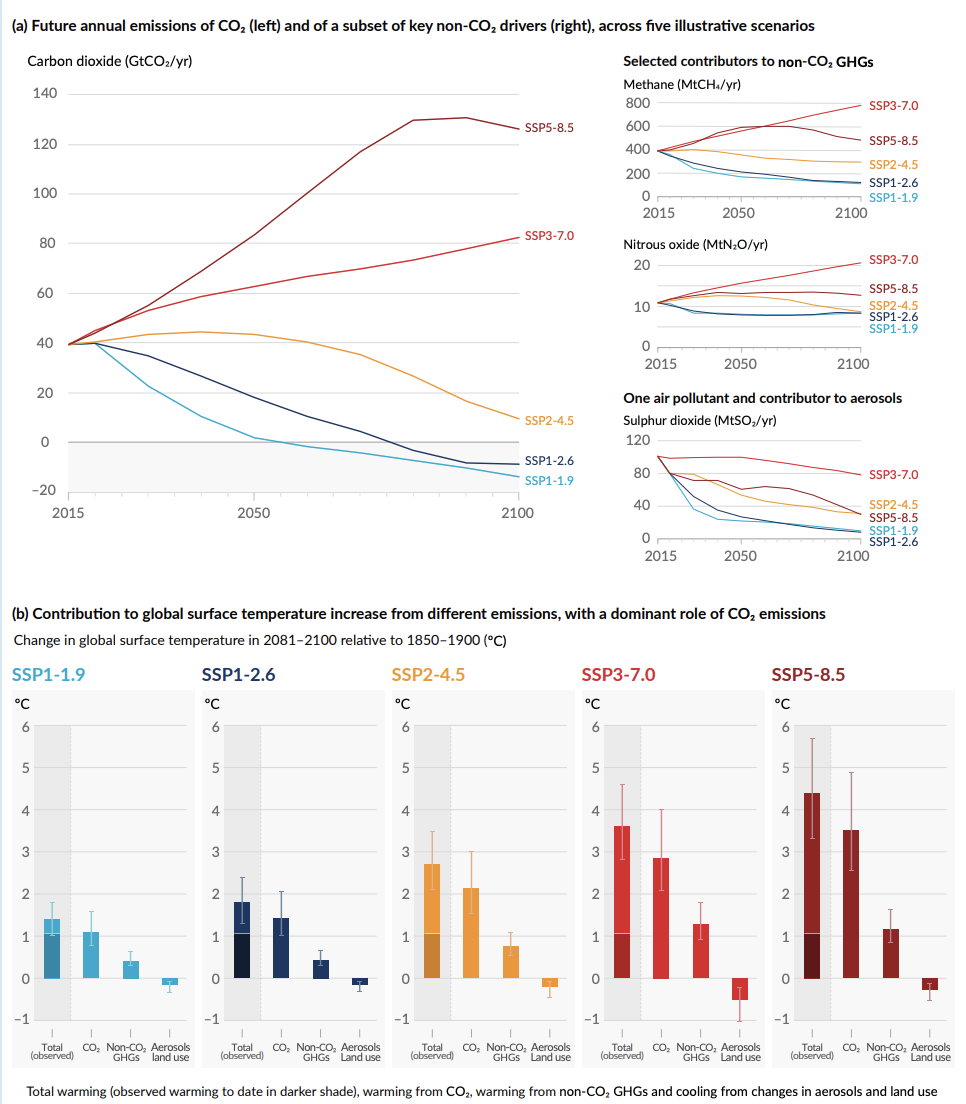
Figure 7. a) presents the annual anthropogenic (human-caused) emissions over the 2015–2100 period. Shown are emissions trajectories for carbon dioxide (CO2) from all sectors (GtCO2/yr) (left graph) and for a subset of three key non-CO2 drivers considered in the scenarios: methane (CH4, MtCH4/yr); nitrous oxide (N2O, MtN2O/yr); and sulphur dioxide (SO2, MtSO2/yr), contributing to anthropogenic aerosols in panel (b). b) demonstrates the change in global surface temperature (°C) in 2081–2100 relative to 1850–1900 given the warming contributions by groups of anthropogenic drivers and by scenario, with indication of the observed warming to date. Bars and whiskers represent median values and the very likely range, respectively. Within each scenario bar plot, the bars represent: total global warming (°C); warming contributions from changes in CO2; non-CO2 greenhouse gases and net cooling from other anthropogenic drivers (‘aerosols and land use’ bar).
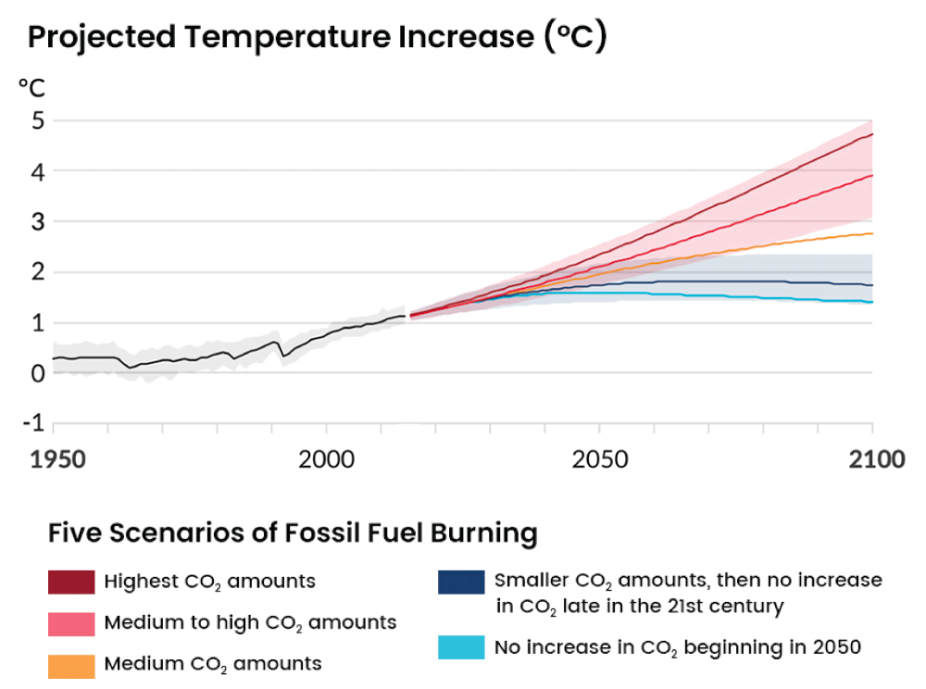
Figure 8. The amount of climate change by the end of the century depends on decisions we make today. If we reduce CO2 amounts to stop increasing after 2050, global average temperature will increase from 1-1.5°C, and this is considered a best case scenario (blue line in graph). If we don’t reduce CO2 and the amounts continue to increase, the worst case scenario warming will be 4.5-5°C (red line in graph). Source, IPCC Working Group I, 2021.
Narrative descriptions for the Shared Socioeconomic Pathways:
SSP1 “Sustainability” (Low challenges to mitigation and adaptation)
The world shifts gradually, but pervasively, toward a more sustainable path, emphasizing more inclusive development that respects perceived environmental boundaries. Management of the global commons slowly improves, educational and health investments accelerate the demographic transition, and the emphasis on economic growth shifts toward a broader emphasis on human well-being. Driven by an increasing commitment to achieving development goals, inequality is reduced both across and within countries. Consumption is oriented toward low material growth and lower resource and energy intensity. The combination of directed development of environmentally friendly technologies, a favorable outlook for renewable energy, institutions that can facilitate international cooperation, and relatively low energy demand results in relatively low challenges to mitigation. At the same time, the improvements in human well-being, along with strong and flexible global, regional, and national institutions imply low challenges to adaptation.
SSP2 “Middle of the Road” (Medium challenges to mitigation and adaptation)
The world follows a path in which social, economic, and technological trends do not shift markedly from historical patterns. Development and income growth proceeds unevenly, with some countries making relatively good progress while others fall short of expectations. Global and national institutions work toward but make slow progress in achieving sustainable development goals. Environmental systems experience degradation, although there are some improvements and overall the intensity of resource and energy use declines. Global population growth is moderate and levels off in the second half of the century. Income inequality persists or improves only slowly and challenges to reducing vulnerability to societal and environmental changes remain. These moderate development trends leave the world, on average, facing moderate challenges to mitigation and adaptation, but with significant heterogeneities across and within countries
SSP3 “Regional Rivalry” (High challenges to mitigation and adaptation)
A resurgent nationalism, concerns about competitiveness and security, and regional conflicts push countries to increasingly focus on domestic or, at most, regional issues. Policies shift over time to become increasingly oriented toward national and regional security issues. Countries focus on achieving energy and food security goals within their own regions at the expense of broader-based development. Investments in education and technological development decline. Economic development is slow, consumption is material-intensive, and inequalities persist or worsen over time. Population growth is low in industrialized and high in developing countries. A low international priority for addressing environmental concerns leads to strong environmental degradation in some regions. Growing resource intensity and fossil fuel dependency along with difficulty in achieving international cooperation and slow technological change imply high challenges to mitigation. The limited progress on human development, slow income growth, and lack of effective institutions, especially those that can act across regions, implies high challenges to adaptation for many groups in all regions.
SSP5 “Fossil-fueled Development” (High challenges to mitigation, low challenges to adaptation)
This world places increasing faith in competitive markets, innovation and participatory societies to produce rapid technological progress and development of human capital as the path to sustainable development. Global markets are increasingly integrated. There are also strong investments in health, education, and institutions to enhance human and social capital. At the same time, the push for economic and social development is coupled with the exploitation of abundant fossil fuel resources and the adoption of resource and energy intensive lifestyles around the world. All these factors lead to rapid growth of the global economy, while global population peaks and declines in the 21st century. Local environmental problems like air pollution are successfully managed. There is faith in the ability to effectively manage social and ecological systems, including by geo-engineering if necessary. While local environmental impacts are addressed effectively by technological solutions, there is relatively little effort to avoid potential global environmental impacts due to a perceived tradeoff with progress on economic development. The strong reliance on fossil fuels and the lack of global environmental concern result in potentially high challenges to mitigation. The attainment of human development goals, robust economic growth, and highly engineered infrastructure results in relatively low challenges to adaptation to any potential climate change for all but a few.
For a complete description of SSP Narratives, see O'Neill et al. 2017
CMIP5
The Representative Concentration Pathways (RCPs), presented in CMIP5, describe four different 21st century pathways. The RCPs include a stringent mitigation scenario (RCP2.6), two intermediate scenarios (RCP4.5 and RCP6.0) and one scenario with high GHG emissions (RCP8.5). Scenarios without additional efforts to constrain emissions (’baseline scenarios’) lead to pathways ranging between RCP6.0 and RCP8.5. Each RCP shows the planet trapping progressively higher amounts of energy from RCP2.6 (the lowest) to RCP8.5 (the highest). Figure 9 shows the GHG emission pathways for each RCP through to the end of the century.
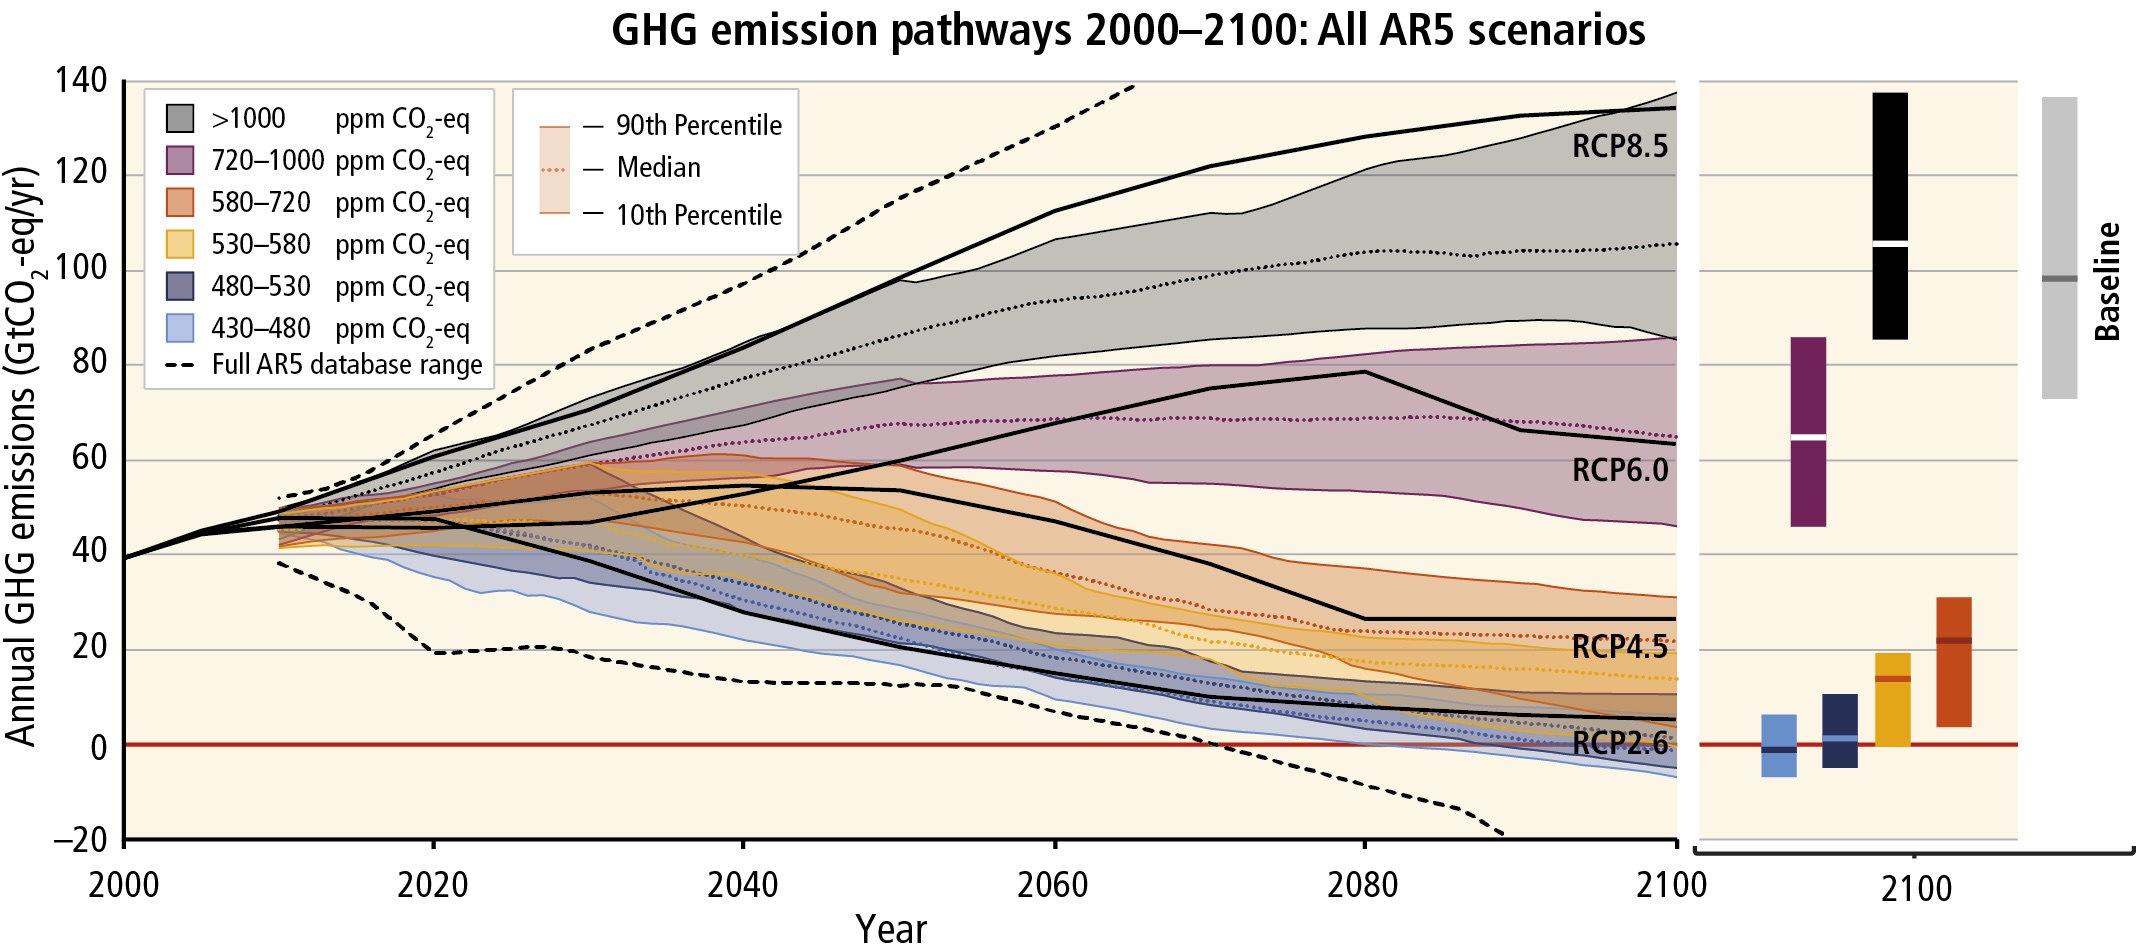
Figure 9. GHG Emission Pathways for each RCP from 2000-2100. Source, IPCC Working Group I, 2013
RCP scenarios are described below.
Stringent mitigation scenario (RCP2.6): A "peak-and-decline" scenario; its radiative forcing level first reaches a value of around 3.1 W/m2 by mid-century and returns to 2.6 W/m
2by 2100. In order to reach such radiative forcing levels, GHG emissions (and indirectly emissions of air pollutants) are reduced substantially over time. RCP2.6 is representative of a scenario that aims to keep global warming likely below 2°C above pre-industrial temperaturesMedium-low emissions scenario (RCP4.5): A stabilization scenario which assumes action is taken to curb climate change by all countries resulting in a global average temperature rise of no more than 2 ºC and 3 ºC above pre-industrial temperature levels by the year 2100.
Medium-high emission scenario (RCP6.0): A stabilization scenario in which total radiative forcing is stabilized shortly after 2100, without overshoot by the application of a range of technologies and strategies for reducing GHG emissions
High-end emissions scenario (RCP8.5): This scenario represents the extreme end of plausible climate change, delivering an estimated global average temperature increase of approximately 5-6ºC by 2100, relative to pre-industrial temperature levels. RCP8.5 is commonly recognized as ‘business as usual’.
Individual Models vs. Multi-Model Ensembles
Climate models are mathematical representations of processes important in the Earth’s climate system. When a climate model is run it produces a 'simulation' of future climate. Multiple simulations form an ensemble. A multi-model ensemble (MME) therefore is a large number of climate model simulations. CCKP prioritizes use of MMEs for its projections as multi-model ensembles are more robust and proven to be most successful in representing the range of expected changes. Differences between the spatial structure of the data and the structure of the reality it represents must also be understood and considered in order to adequately model the impact of spatial uncertainty on model applications. While, individual models are noisier, on occasion they may better reflect the range of variability compared to the multi-model ensemble that is generally too smooth. Individual models can also have systematic biases that present themselves as strong outliers. A comparison with the multi-model ensemble is helpful to identify these potential biases and outliers.
Variability, Trends, Uncertainty
Decadal, inter-annual, and inter-seasonal variability exists across the climate system. Internal variability can diminish the relevance of trends over periods as short as 10 to 15 years from long-term climate change. A critical effort of projecting climate change is to understand if ‘change’ is part of the natural variability or if projected change reveals trends that are statistically significant from natural variability. Due to this, natural variability trends based on short records are very sensitive to the beginning and end dates and do not, in general, reflect longer-term climate trends.
Uncertainty exists for any future projection. While advances continue to be made in the understanding of climate physics and the response of the climate system to increases in greenhouse gases, many uncertainties are likely to persist. The rate of future global warming depends on future emissions, feedback processes that dampen or reinforce disturbances to the climate system, and unpredictable natural influences on climate, like volcanic eruptions. Uncertain processes that will affect how fast the world warms for a given emissions pathway are dominated by cloud formation, but also include water vapor and ice feedbacks, ocean circulation changes, and natural cycles of greenhouse gases. Although information from past climate changes largely corroborates model calculations, this is also can have a degree of uncertainty due to potentially important factors about which we have incomplete information.
References
Clark, P., Shakun, J., Marcott, S. et al., 2016: Consequences of twenty-first-century policy for multi-millennial climate and sea-level change. Nature Clim Change 6, 360–369. DOI:https://doi.org/10.1038/nclimate2923
Eyring, V., Bony, S., Meehl, G. A., Senior, C. A., Stevens, B., Stouffer, R. J., & Taylor, K. E. (2016). Overview of the Coupled Model Intercomparison Project Phase 6 (CMIP6) experimental design and organization. Geoscientific Model Development, 9(5), 1937–1958. https://doi.org/10.5194/gmd-9-1937-2016.
IPCC, 2013: Climate Change 2013: Technical Summary. The Physical Science Basis. Contribution of Working Group I to the Fifth Assessment Report of the Intergovernmental Panel on Climate Change [Stocker, T.F., D. Qin, G.-K. Plattner, M. Tignor, S.K. Allen, J. Boschung, A. Nauels, Y. Xia, V. Bex and P.M. Midgley (eds.)]. Cambridge University Press, Cambridge, United Kingdom and New York, NY, USA. URL:https://www.ipcc.ch/site/assets/uploads/2018/02/WG1AR5_TS_FINAL.pdf
IPCC, 2014: Climate Change 2014: Synthesis Report. Contribution of Working Groups I, II and III to the Fifth Assessment Report of the Intergovernmental Panel on Climate Change [Core Writing Team, R.K. Pachauri and L.A. Meyer (eds.)]. IPCC, Geneva, Switzerland, 151 pp. URL: https://ar5-syr.ipcc.ch/ipcc/ipcc/resources/pdf/IPCC_SynthesisReport.pdf
IPCC, 2021: Summary for Policymakers. In: Climate Change 2021: The Physical Science Basis. Contribution of Working Group I to the Sixth Assessment Report of the Intergovernmental Panel on Climate Change [Masson-Delmotte, V., P. Zhai, A. Pirani, S.L. Connors, C. Péan, S. Berger, N. Caud, Y. Chen, L. Goldfarb, M.I. Gomis, M. Huang, K. Leitzell, E. Lonnoy, J.B.R. Matthews, T.K. Maycock, T. Waterfield, O. Yelekçi, R. Yu, and B. Zhou (eds.)]. In Press. URL:https://www.ipcc.ch/report/ar6/wg1/downloads/report/IPCC_AR6_WGI_SPM_final.pdf
International Institute for Applied Systems Analysis (IIASA), 2014: Representative Concentration Pathways Database. URL: https://iiasa.ac.at/web/home/research/researchPrograms/TransitionstoNewTechnologies/RCP.en.html
Kriegler, E., Edmonds, J., Hallegatte, S., et al., 2014: A new scenario framework for climate change research: the concept of shared climate policy assumptions, Climatic Change 122:401–414. DOI:doi:10.1007/s10584-013-0971-5
O'Neill, B., Tebaldi, C., Van Vuuren, D., et al., 2016: The Scenario Model Intercomparison Project (ScenarioMIP) for CMIP6, Geoscience Model Development 9, 3461–3482. DOI:doi:10.5194/gmd-9-3461-2016
O'Neill, B., Kriegler, E., Ebi, K. et al., 2017: The roads ahead: Narratives for shared socioeconomic pathways describing world futures in the 21st century. Global Environmental Change 42, 169-180. DOI:https://doi.org/10.1016/j.gloenvcha.2015.01.004
O'Neill, B., Carter, T., Ebi, K., et al., 2020: Achievements and needs for the climate change scenario framework. Nature Climate Change 10, 1074-1084. DOI:https://doi.org/10.1038/s41558-020-00952-0
Riahi, K. van Vuuren, D., Kriegler, E., et al. 2017: The Shared Socioeconomic Pathways and their energy, land use, and greenhouse gas emissions implications: An overview, Global Environmental Change 42, 153–168. DOI:doi:10.1016/j.gloenvcha.2016.05.009
Van Vuuren, D., Edmonds, J. Kainuma, M., et al., 2011: The representative concentration pathways: an overview, Climatic Change volume 109, Article number: 5. DOI: doi:10.1007/s10584-011-0148-z
World Climate Research Program (WCRP), 2021: WCRP Coupled Model Intercomparison Project (CMIP). URL: https://www.wcrp-climate.org/wgcm-cmip
World Climate Research Program (WCRP), 2021: PMIP – Paleoclimate Modeling Intercomparison Project. URL: https://www.wcrp-climate.org/modelling-wgcm-mip-catalogue/cmip6-endorsed-mips-article/1064-modelling-cmip6-pmip